
The Flaw of Averages: Why We Underestimate Risk in the Face of Uncertainty
by Sam L. Savage
This is a book about how to manage in a world of uncertainty. The beginning section presents a number of statistical concepts in simplified language; more sophisticated techniques follow. The author discusses how these concepts apply in a wide variety of contexts including oil exploration, pharmaceutical R&D, the stock market, the housing bubble, weather, climate change, health care, gene pools, the war of terror, and supply chains. He also describes some illogical accounting rules required by the FASB and the SEC.
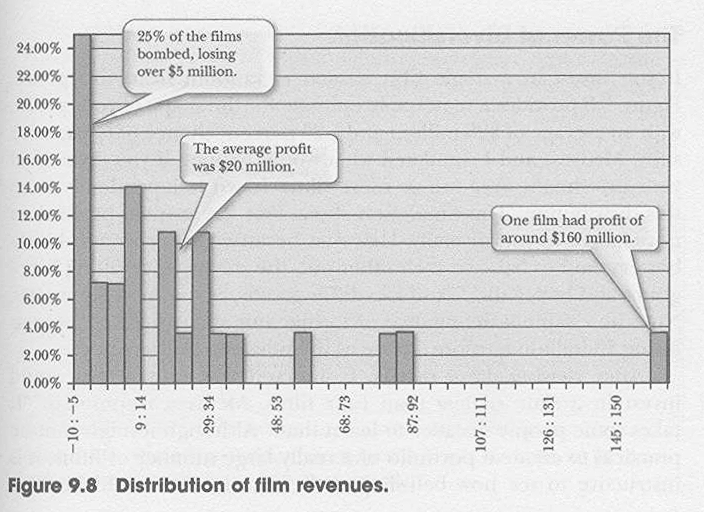
DISTRIBUTIONS. At its core, the Flaw of Averages is an oversimplified view of reality by fixating on a single number. “If organizations are to conquer the Flaw of Averages, they must start dealing in probability distributions, not in single numbers.” A simple way to view a distribution is a histogram. Figure 9.8 shows the profit of “28 live-action films of a particular genre, which had been selected so as not to over-represent any single theme or star.” The average profit is $20 million, but the histogram reveals a much more insightful picture of the risk: 25% of the films lost more than $5 million.
DIVERSIFICATION. If you invested in making one film, you’d have a 25% chance of losing your shirt, but the author ran some simulations to determine that investing in a portfolio of only four films would reduce the risk of loss to 1%, with the average profit remaining $20 million.
MODELS. “The surest way I know to detect the Flaw of Averages is the build a small spreadsheet model of your business situation and simulate the uncertainties you face. A good model improves your intuition by connecting the seat of your intellect to the seat of your pants… The best models are those you no longer need because they have changed the way you think… Most large financial organizations spend millions of dollars on complex risk models… that may actually mask what’s going on… What they need are simple models that everyone understands.”
UNCERTAINTY VERSUS RISK. “The terms ‘uncertainty’ and ‘risk’ are often used interchangeably, but they shouldn’t be… I consider uncertainty to be an objective feature of the universe, whereas risk is in the eye of the beholder.” Some people are more risk-averse than others when faced with the same uncertainty.
INTERRELATED UNCERTAINTIES. “People also use the term Statistical Dependence when discussing interrelated uncertainties, but this phrase implies that one uncertainty depends on another, when in fact the relationship may be mutual. So I will stick to interrelated uncertainties instead… Scatter plots are my favorite way to grasp the interrelationships between uncertain numbers.”
INFORMATION. “Information is the complement of uncertainty; that is, for every uncertainty, there is information that would reduce or remove it. Sometimes such information is cheap, and sometimes it is unavailable at any price… Information has no value at all unless it has the potential to change a decision.”
EXTREMES. “Did I mention where one would find the smallest average earlobes? Small towns, of course. The sizes of towns and earlobes have nothing to do with each other; it’s just that averages with small samples have more variability than averages over large samples.”
OPTIONS. “Recall the example of the gas well… that was worth $500,000 given the average price of gas but was worth $1 million on average. The increased value was due to the option not to pump in the event that the gas price was below the production cost. An opportunity such as this is known as a real option, and it is analogous to a call option on the gas, with a strike price equal to the pumping cost.”
FUTURES. “Given how terrible individuals are at estimating probabilities, it is a profound result that marketplaces usually get them right… For example, a classic 1984 paper by UCLA finance professor Richard Roll shows that the futures market in frozen concentrated orange juice is a better predictor of Florida weather than the National Weather Service… Although the futures markets predict the average future values of assets, as we have seen, option prices indicate the degree of uncertainty.”
ORGANIZATIONAL BOUNDARIES. David Cawlfield writes, “Of course the Flaw of Averages occurs everywhere, but often the flaws are small and go unnoticed, or the consequences are insignificant. At organizational boundaries the Flaw can cause real damage. This is where most of the cross-communication occurs between upper level managers, and involves decisions with large consequences. Lower in the organization, experts with the most knowledge about variability leave out the gory details about day-to-day ups and downs by communicating only the ‘big picture’ to the boss… An understanding of variability constitutes a large portion of the value of long work experience. The secret of successful Probability Management is learning to capture this understanding in a stochastic library.”
THE DECISION FOREST. “A firm introducing a new product lineup should use a portfolio approach to avoid risks due to both cannibalization and potential competitive products. A portfolio of pharmaceutical R&D projects would be designed with both competitive drugs and potential governmental regulation changes in mind. Most people [don’t take] true portfolio effects into account… Think of each project as a decision tree reflecting uncertainties that pertain only to that project… This results in a bunch of decision trees or a decision forest… But modeling all of the individual projects as decision trees is not enough, because, as discussed earlier, portfolio decisions must reflect he interrelationships between constituent parts. For this, I model global uncertainties such as the price of oil or political upheaval as the winds of fortune, which blow through the entire forest, influencing all the trees at once.”
MONTE CARLO. “A computational technique similar to the shaking of a ladder can test the stability of uncertain business plans, engineering designs, or military campaigns. Monte Carlo simulation, as it is known, bombards a model of the business, bridge, or battle with thousands of random inputs, while keeping track of the outputs. This allows you to estimate the chance that the business will go bust, the bridge will fall down, or the battle will be lost. The shaking forces you apply to the ladder are known as the input probability distribution and correspond to the uncertainty demand levels for your product, the magnitudes of potential earthquakes, or the sizes of the enemy forces you will encounter. The subsequent movements of the ladder are known as the output probability distribution and correspond to the profit of the business, the deflection of the bridge, or the number of casualties you suffer.”
DISTRIBUTION STRING. “The sum of the simulations of the parts is not the simulation of the whole… The key is a new computer data type called the Distribution String (DIST), which encapsulated distributions in a manner that allows them to be added together like numbers… In terms of the spinner, think of the DIST as consisting of the outcomes of one thousand spins, stuffed, like a genie in a bottle, into a single cell in your spreadsheet.”
SCENARIO LIBRARIES. In this example, risk is estimated across two banking divisions. “First, the chief probability officer (CPO) generates the distribution of housing market conditions. This is provided as a stochastic information packet (SIP)… One input SIP went in, and two output SIPs came out… They now form a scenario library unit with relationships preserved (SLURP), which maintains the dependence of each division on the housing market. The final step is just to add the output SIPs of the two divisions together to create the SIP of total profit… With SLURPs, the simulation of the sum does equal the sum of the simulations because it preserves the interrelationships… If you ignore the interrelationships, you would calculate the chance that both divisions lose money at the same time as 2/6 x 1/6 = 2/36 = 1/18.” With the consolidated method, “the chance of losing money is not 1 in 18 after all, but 1 in 3, six times greater!”
“If a CPO has no idea of a particular distribution, they should pull several different ones from the seat of their pants and see how the results differ under each. Today’s interactive simulations are so fast that you can actually enter probabilities as variables and discover at what point you would make different decisions.”
“But let’s not forget that risk is not inherently bad. In fact, risk, clearly presented and understood, is required for people to make investments. And if people don’t make investments, society pretty much grinds to a halt. Let’s also not forget that risk is in the eye of the beholder and that the risk attitude that a publicly traded firm should take on is the one anticipated by its shareholders. Unlike its employees, who may be more concerned about keeping their jobs than making profit, the shareholders, who are generally diversified across many other investments, want the firm to take the business risks that induced them to invest in the first place.”
Savage, Sam L. The Flaw of Averages: Why We Underestimate Risk in the Face of Uncertainty. Hoboken, New Jersey: John Wiley & Sons, 2012. Buy from Amazon.com
Disclosure: As an Amazon Associate I earn from qualifying purchases.
Other books referred to in this text:
- Why Can’t You Just Give Me the Number? by Patrick Leach
- Serious Play by Michael Schrage
- The Selfish Gene by Richard Dawkins
- Ten Rules for Strategic Innovators: From Idea to Execution by Vijay Govinfarajan and Chris Trimble
- The Black Swan: The Impact of the Highly Improbable by Nassim Nicholas Taleb
- The Wisdom of Crowds by James Surowiecki
- More Harm Than Good by Alan Zelicoff M.D. and Michael Bellomo
- Full House: The Spread of Excellence from Plato to Darwin by Stephen Jay Gould
- Action in Perception by Alva Nӧe
- On Intelligence by Jeff Hawkins and Sandra Blakeslee
- The Visual Display of Quantitative Data by Edward Tufte
- How to Lie with Statistics by Darrell Huff
- Structured Finance and Collateralized Debt Obligations by Janet Tavakoli
- Wikinomics by Don Tapscott and Anthony Williams
- How to Measure Anything: Finding the Value of Intangibles in Business by Doug Hubbard
- The Failure of Risk Management: Why It’s Broken and How to Fix It by Doug Hubbard
Discover more from The Key Point
Subscribe to get the latest posts sent to your email.

11 thoughts on “The Flaw of Averages”
Comments are closed.