HBR Guide to Data Analytics Basics for Managers
The objective of this book is to help managers make better data-driven decisions by working with data analysts and data scientists. The guide is a compendium adapted from 23 previously published Harvard Business Review and hbr.org articles.
“Framing a problem… is the most important stage of the analytical process for a consumer of big data. It’s where your business experience and intuition matter most. After all, a hypothesis is simply a hunch about how the world works. The difference with analytical thinking, of course, is that you use rigorous methods to test the hypothesis.”
“Establish a culture of inquiry, not advocacy… Analytics consumers should never pressure their producers with comments like ‘See if you can find some evidence in the data to support my idea.’ Instead, your explicit goal should be to find the truth.”
“Your question should be testable, which means it must be narrow and clearly defined… Most data comes come fragments. To be useful, these individual bits of information need to be put together into a coherent explanation of the business situation… Does our data help us look ahead rather than behind? … Do we have a good mix of quantitative and qualitative data? Neither quantitative nor qualitative data tells the whole story… We need to know not only what is being sold to whom, but also why some products are selling more than others.”
“Focus on outcomes, not indicators.” A case in point is a nonprofit which generated 1.5 million views to a YouTube video soliciting donations of used sports equipment. The video did not generate even one donation.
“Naturally, financial metrics can’t capture all value-creating activities. You also need to assess nonfinancial measures such as customer loyalty, customer satisfaction, and product quality, and determine if they can be directly linked to the financial measures that ultimately deliver value.”
STATISTICS. To help understand data analysis, the book includes chapters on correlation, significance, and regression.
“Regression analysis is the go-to method in analytics,” according to Thomas Redman, author of Data Driven. “The way most analyses go haywire is the manager hasn’t narrowed the focus on what he or she is looking for… It’s your job to identify the factors that you suspect are having an impact and ask your analyst to look at those.”
“Also keep in mind whether or not you can do anything about the independent variable you’re considering. You can’t change how much it rains, so how important is it to understand that?”
Data analysis is not a substitute good judgment. “Redman suggests you look to more experienced managers or other analyses if you’re getting something that doesn’t make sense… ‘You need to pair any analysis with study of the real world… What’s the physical mechanism that’s causing the relationship? … The goal is not to figure out what is going on in the data but to figure out what is going on in the world.’”
When should you act on a correlation? “If the value of acting is high, and the cost of acting when wrong is low, it can make sense to act based on even a weak correlation… Alternatively, if the confidence in the finding is low due to the fact you don’t have a handle on why two events are linked, you should be less willing to take actions that have significant potential downside.”
“Statistical Significance helps quantify whether a result is likely due to chance or to some factor of interest… Even if a finding isn’t statistically significant, it may have utility to you and your company. On the other hand… it’s possible to obtain results that are statistically significant but practically meaningless, for example, that a group is 0.000001% more likely to click on campaign A over campaign B… So rather than obsessing about whether your findings are precisely right, think about the implication of each finding for the decision you’re hoping to make. What would you do differently if the finding were different?”
NONLINEAR RELATIONSHIPS. My favorite chapter is titled Linear Thinking in a Nonlinear World. “Decades of research in cognitive psychology show that the human mind struggles to understand nonlinear relationships. Our brain wants to make simple straight lines… But in business there are many highly nonlinear relationships.” Nonlinearity is easier to comprehend visually.
“Averages mask nonlinearity and lead to prediction errors.”
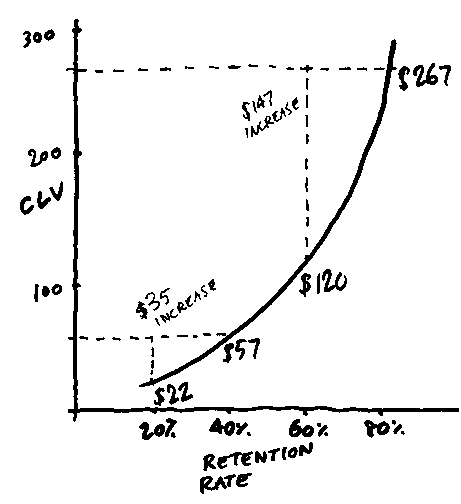
“Most companies focus on identifying customers who are most likely to defect and then target them with marketing programs. However, it’s usually more profitable to focus on customers who are more likely to stay. Linear thinking leads managers to underestimate the benefits of small increases to high retention rates.” For example, if you calculate a customer lifetime value (CLV) assuming a contribution margin of $100 and a discount rate of 10%, “when the retention rate rises from 20% to 40%, CLV goes up about $35… but when retention rates rise from 60% to 80%, CLV goes up about $147. As retention rates rise, customer lifetime value increases gradually at first and then suddenly shoots up.”
Surveys using 1-to-5 scales generally do not predict behavior in a linear fashion. “In reality, research shows little or no behavioral difference between consumers who, on a five-point scale, give their environmental concern the lowest rating, 1, and consumers who rate it a 4. But the difference between 4s and 5s is huge. Behavior maps to attitudes on a curve, not a straight line.”
Pricing is another area where nonlinear relationships comes into play.
DATA SCIENTISTS. “Data scientists’ most basic, universal skill is the ability to write code… But we would say the dominant trait among data scientists is an intense curiosity—a desire to go beneath the surface of a problem, find the questions at its heart, and distill them into a very clear set of hypotheses that can be tested… More enduring will be the need for data scientists to communicate in language that all their stakeholders understand… [They] need close relationships with the rest of the business. The most important ties for them to forge are with executives in charge of products and services rather than with people overseeing business functions.”
UNSTRUCTURED DATA. One other challenge for data analytics is that “unstructured data is estimated to make up 95% of the world’s data… For many large companies, storing and manipulating unstructured data may require a significant investment of resources to extract necessary information. Working with your data scientists, evaluate the additional costs of using unstructured data when defining your initial objectives.”
HBR Guide to Data Analytics Basics for Managers. Boston: Harvard Business Review Press, 2018. Buy from Amazon.com
Disclosure: As an Amazon Associate I earn from qualifying purchases. I received a review copy of this book.
Discover more from The Key Point
Subscribe to get the latest posts sent to your email.

One thought on “HBR Guide to Data Analytics Basics for Managers”
Comments are closed.